fig = plt.figure(figsize=(2.5,4.1))
axes = gs.GridSpec(nrows=2, ncols=2, figure=fig,
left=0.11, right=0.98, top=0.94, bottom=0.36, wspace=0.3, hspace=0.45)
ax_accuracy = fig.add_subplot(gs.GridSpec(nrows=1, ncols=1, figure=fig,
left=0.11, right=0.98, top=0.27, bottom=0.07)[0])
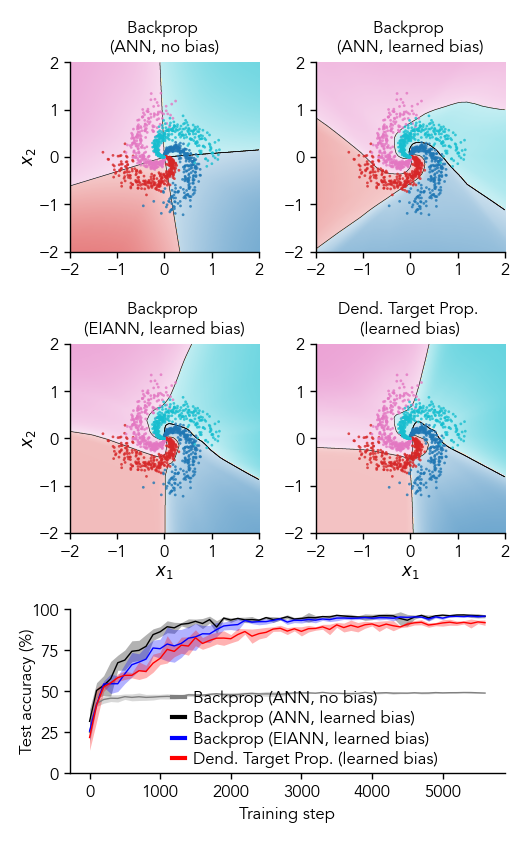
model_dict_all["bpDale_learned_bias_spiral"]["label"] = "Backprop (EIANN, learned bias)"
model_dict_all["DTP_learned_bias_spiral"]["label"] = "Dend. Target Prop. (learned bias)"
model_dict_all["vanBP_2_hidden_zero_bias_spiral"]["label"] = "Backprop (ANN, no bias)"
model_dict_all["vanBP_2_hidden_learned_bias_spiral"]["label"] = "Backprop (ANN, learned bias)"
for key in model_dict_all:
model_dict_all[key]["title"] = model_dict_all[key]["label"].replace("(", "\n(")
for i, model_key in enumerate(model_list):
model_dict = model_dict_all[model_key]
network_name = model_dict['config'].split('.')[0]
hdf5_path = root_dir + f"/EIANN/data/model_hdf5_plot_data/plot_data_{network_name}.h5"
with h5py.File(hdf5_path, 'r') as f:
data_dict = f[network_name]
print(f"Generating plots for {model_dict['label']}")
seed = model_dict['seeds'][0] # example seed to plot
# Plot spirals
ax = fig.add_subplot(axes[i])
decision_data = data_dict[seed]['spiral_decision_data_dict']
pt.plot_spiral_decisions(decision_data, ax=ax)
ax.set_aspect('equal')
ax.set_title(model_dict["title"], pad=4, fontsize=6)
if i < 2:
ax.set_xlabel('')
if i%2!=0:
ax.set_ylabel('')
ax.set_ylabel(ax.get_ylabel(), labelpad=0)
ax.set_xlabel(ax.get_xlabel(), labelpad=1)
# Plot metrics
plot_accuracy_all_seeds(data_dict, model_dict, ax=ax_accuracy)
fig.savefig(f"{root_dir}/EIANN/figures/{figure_name}.png", dpi=300)
fig.savefig(f"{root_dir}/EIANN/figures/{figure_name}.svg", dpi=300)