fig = plt.figure(figsize=(6.5, 2.4), dpi=280)
axes = gs.GridSpec(nrows=2, ncols=3, figure=fig,
left=0.28,right=0.98,
top=0.94, bottom = 0.12,
wspace=0.7, hspace=0.7)
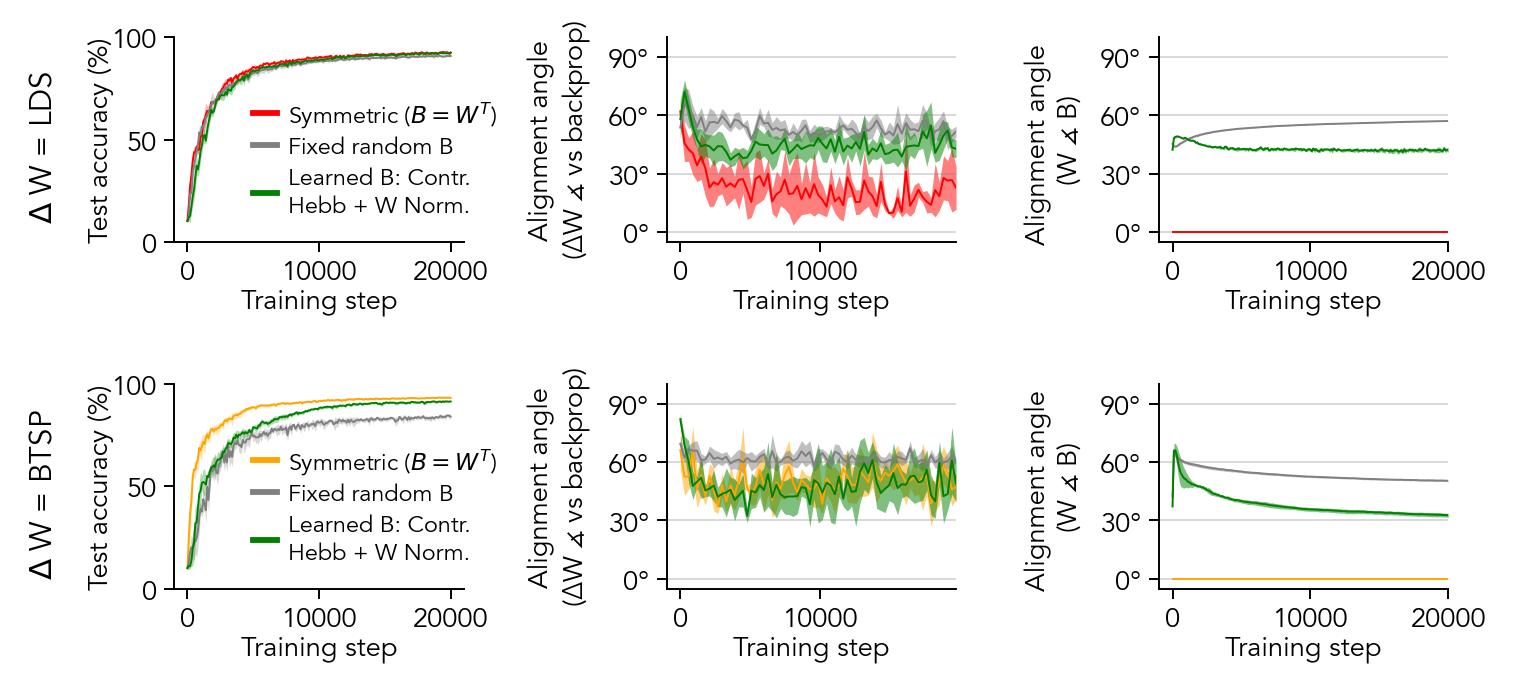
model_dict_all["bpLike_WT_hebbdend"]["display_name"] = "$\Delta$ W = LDS"
model_dict_all["bpLike_WT_hebbdend"]["label"] = "Symmetric ($B=W^T$)"
model_dict_all["BTSP_WT_hebbdend"]["display_name"] = "$\Delta$ W = BTSP"
model_dict_all["BTSP_WT_hebbdend"]["label"] = "Symmetric ($B=W^T$)"
for row, model_list in enumerate([model_list1, model_list2]):
ax_accuracy = fig.add_subplot(axes[row, 0])
ax_angle_vs_BP = fig.add_subplot(axes[row, 1])
ax_FB_angle = fig.add_subplot(axes[row, 2])
for i, model_key in enumerate(model_list):
model_dict = model_dict_all[model_key]
network_name = model_dict['config'].split('.')[0]
hdf5_path = root_dir + f"/EIANN/data/model_hdf5_plot_data/plot_data_{network_name}.h5"
with h5py.File(hdf5_path, 'r') as f:
data_dict = f[network_name]
# print(f"Generating plots for {model_dict['label']}")
plot_accuracy_all_seeds(data_dict, model_dict, ax=ax_accuracy)
plot_angle_vs_bp_all_seeds(data_dict, model_dict, ax=ax_angle_vs_BP, error='std')
plot_angle_FB_all_seeds(data_dict, model_dict, ax=ax_FB_angle, error='std')
if i == 0:
ax_accuracy.set_title(model_dict['display_name'], rotation=90, x=-0.45, y=0.35, va='center', fontsize=8)
ax_accuracy.set_xlabel(ax_accuracy.get_xlabel(), ha='center', labelpad=0)
ax_angle_vs_BP.set_xlabel(ax_angle_vs_BP.get_xlabel(), ha='center', labelpad=0)
ax_FB_angle.set_xlabel(ax_FB_angle.get_xlabel(), ha='center', labelpad=0)
legend = ax_accuracy.legend(ncol=1, bbox_to_anchor=(0.2, 0.8), loc='upper left', fontsize=6)
for line in legend.get_lines():
line.set_linewidth(1.5)
fig.savefig(f"{root_dir}/EIANN/figures/{figure_name}.png", dpi=300)
fig.savefig(f"{root_dir}/EIANN/figures/{figure_name}.svg", dpi=300)